Touch vs close below the band?
Intraday wicks can tag a band without the candle closing outside it. "Close below the lower band" is stricter and usually produces fewer, higher-conviction signals. Try both and compare trade count.
Strategy template
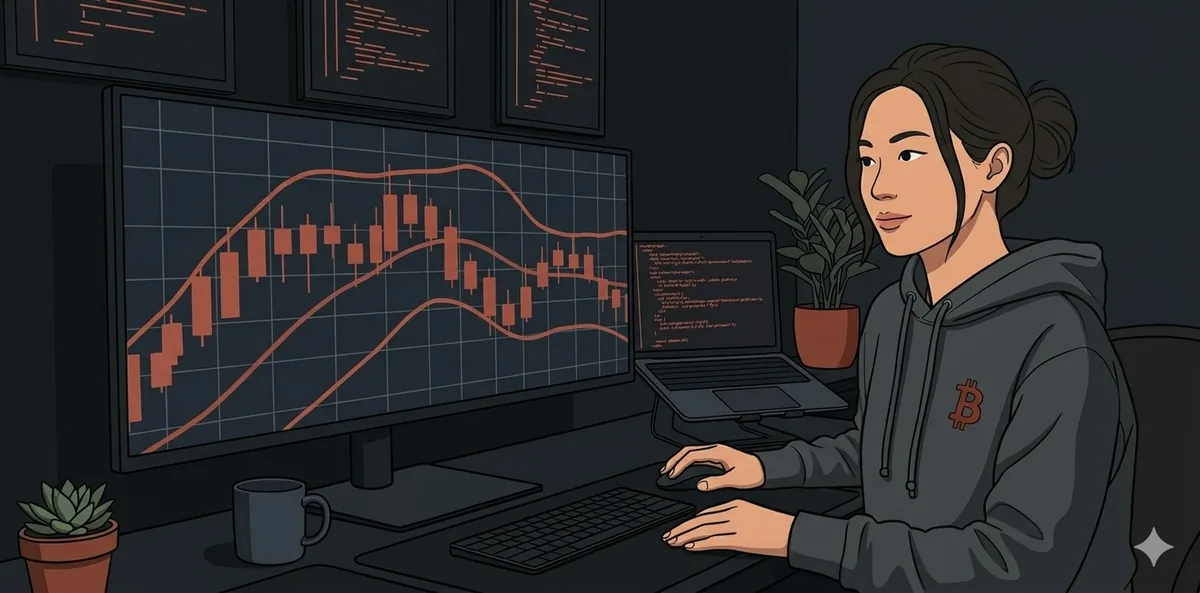
Bollinger bands wrap price in a moving average plus upper and lower envelopes. Mean-reversion traders fade touches of the outer bands — long near the lower band, short near the upper — betting price returns toward the middle. This template mirrors the BTC Bollinger idea from the Torquant landing demo.
Bollinger Bands use a middle SMA(20) with upper and lower bands at 2 standard deviations by default. When volatility expands, the bands widen; when price tags the lower band, the mean-reversion read is that BTC stretched too far down relative to recent history. The upper band is the mirror for shorts.
Band touches happen often in trends too — price can "walk the band" instead of reverting. That is why you backtest: to see whether fades worked on BTC daily over your date range, not because the textbook says they should.
This matches the landing typing demo: long at the lower band, short at the upper, using standard 20-period bands and 2 standard deviations.
Torquant prompt
"BTCUSDT daily from 2020 to today. Bollinger Bands(20, 2). Long when close touches or crosses below the lower band. Short when close touches or crosses above the upper band. Exit long when close reaches the middle band. Exit short when close reaches the middle band. 25% of equity per trade."
Torquant prompt — long-only lower band
"BTCUSDT daily from 2020 to today. Bollinger Bands(20, 2). Long only. Enter when close closes below the lower band. Exit when close closes above the middle band. Use 25% of equity per trade."
Torquant prompt — ETH 4h bands
"ETHUSDT 4h from 2021 to today. Bollinger Bands(20, 2). Long when close touches or crosses below the lower band. Exit when close reaches the middle band. Long only. 30% of equity per trade."
Torquant prompt — wider bands (2.5 std dev)
"BTCUSDT daily from 2020 to today. Bollinger Bands(20, 2.5). Long only. Enter when close closes below the lower band. Exit when close closes above the middle band. 25% of equity per trade."
Simulations use spot market candles. Short and leverage rules are honored when you describe them; perpetual funding and liquidation are not included.
Intraday wicks can tag a band without the candle closing outside it. "Close below the lower band" is stricter and usually produces fewer, higher-conviction signals. Try both and compare trade count.
20-period lookback for the middle SMA, bands plotted 2 standard deviations away. It is the standard default in most charting platforms — a reasonable baseline before you optimize.
Yes. Example: "Long when close is below the lower band and RSI(14) is below 35." Combo filters reduce trades but may cut false fades — test in a follow-up run.
Open Torquant, paste the default prompt, and backtest Bollinger mean reversion on historical BTC candles.