Why RSI(14) and 30/70?
They are the most cited defaults in trading literature, which makes them a sensible baseline. Your edge, if any, may live at 25/60 or on 4h candles instead — that is what iteration is for.
Strategy template
RSI mean reversion is one of the first ideas crypto traders want to test: buy when momentum looks washed out, sell when it recovers. Here is a complete starting point you can paste into Torquant and run on BTC or ETH history.
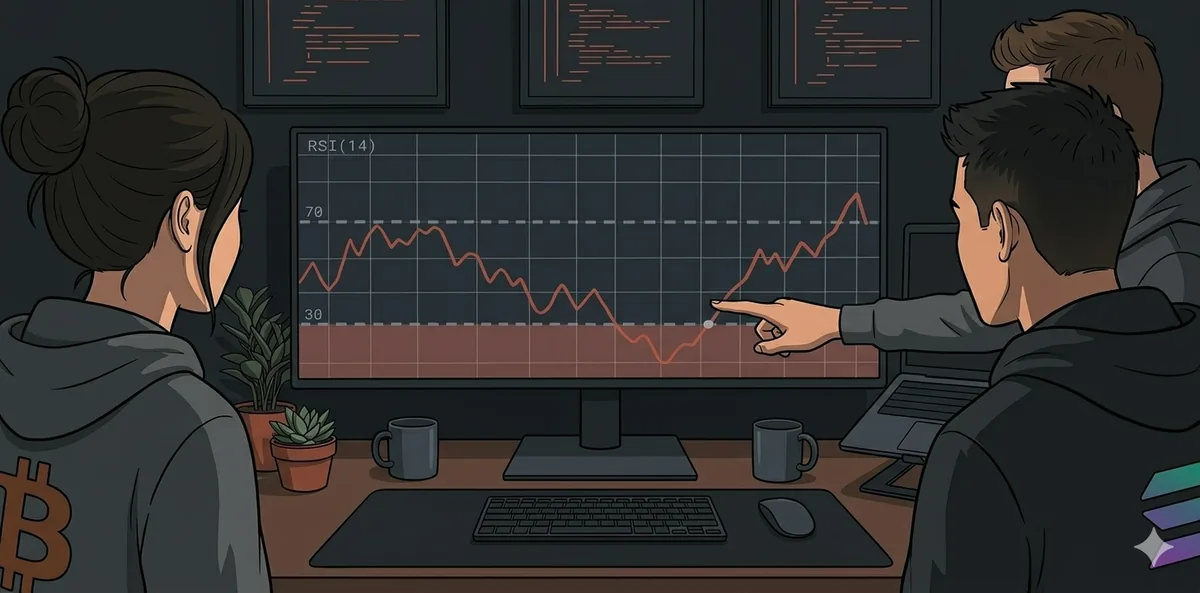
The Relative Strength Index (RSI) measures recent up vs down closes on a 0–100 scale. A common mean-reversion setup uses RSI(14): enter when RSI falls below 30 (oversold), exit when RSI rises above 70 (overbought). On daily crypto candles, that usually means buying sharp pullbacks in BTC or ETH and selling into the bounce.
This is a hypothesis, not a guarantee. RSI can stay oversold in a crash and overbought in a melt-up. The point of backtesting is to see how often the simple rule worked on the pair and window you care about, and whether the drawdown was tolerable.
RSI alone struggles in strong trends. If your backtest shows long stretches underwater, consider adding a trend filter (e.g. only long when price is above a moving average) in a follow-up run.
Copy this into Torquant, click Run Backtest when the strategy is ready, and compare the equity curve to holding BTC over the same period.
Torquant prompt
"BTCUSDT daily from 2020 to today. Long only. Enter when RSI(14) closes below 30. Exit when RSI(14) closes above 70. Use 25% of equity per trade. No stop-loss."
Change one thing per run so you know what moved the result.
Torquant prompt — ETH daily
"ETHUSDT daily from 2020 to today. Long only. Enter when RSI(14) closes below 30. Exit when RSI(14) closes above 65. Use 25% of equity per trade."
Torquant prompt — tighter exit
"BTCUSDT daily from 2020 to today. Long only. Enter when RSI(14) closes below 30. Exit when RSI(14) closes above 55. Use 25% of equity per trade."
Torquant prompt — with trend filter
"BTCUSDT daily from 2020 to today. Long only. Enter when RSI(14) closes below 30 and close is above SMA(200). Exit when RSI(14) closes above 70. Use 25% of equity per trade."
Torquant uses spot market candles for price history. Long, short, and leverage are supported when you specify them; perpetual funding and liquidation are not modeled.
They are the most cited defaults in trading literature, which makes them a sensible baseline. Your edge, if any, may live at 25/60 or on 4h candles instead — that is what iteration is for.
Yes. Replace "daily" with "4h" or "1h" in the prompt and keep the same RSI rules. Shorter timeframes usually produce more trades and more sensitivity to fees and slippage assumptions.
Often worth testing. Mean-reversion entries can catch falling knives. Try "Exit if drawdown from entry exceeds 8%" as a second run and compare drawdown to the no-stop version.
Open Torquant, paste the BTC prompt above, and run your first RSI backtest in minutes.